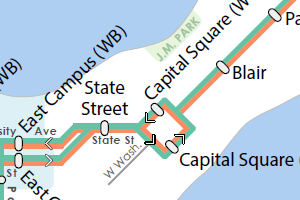
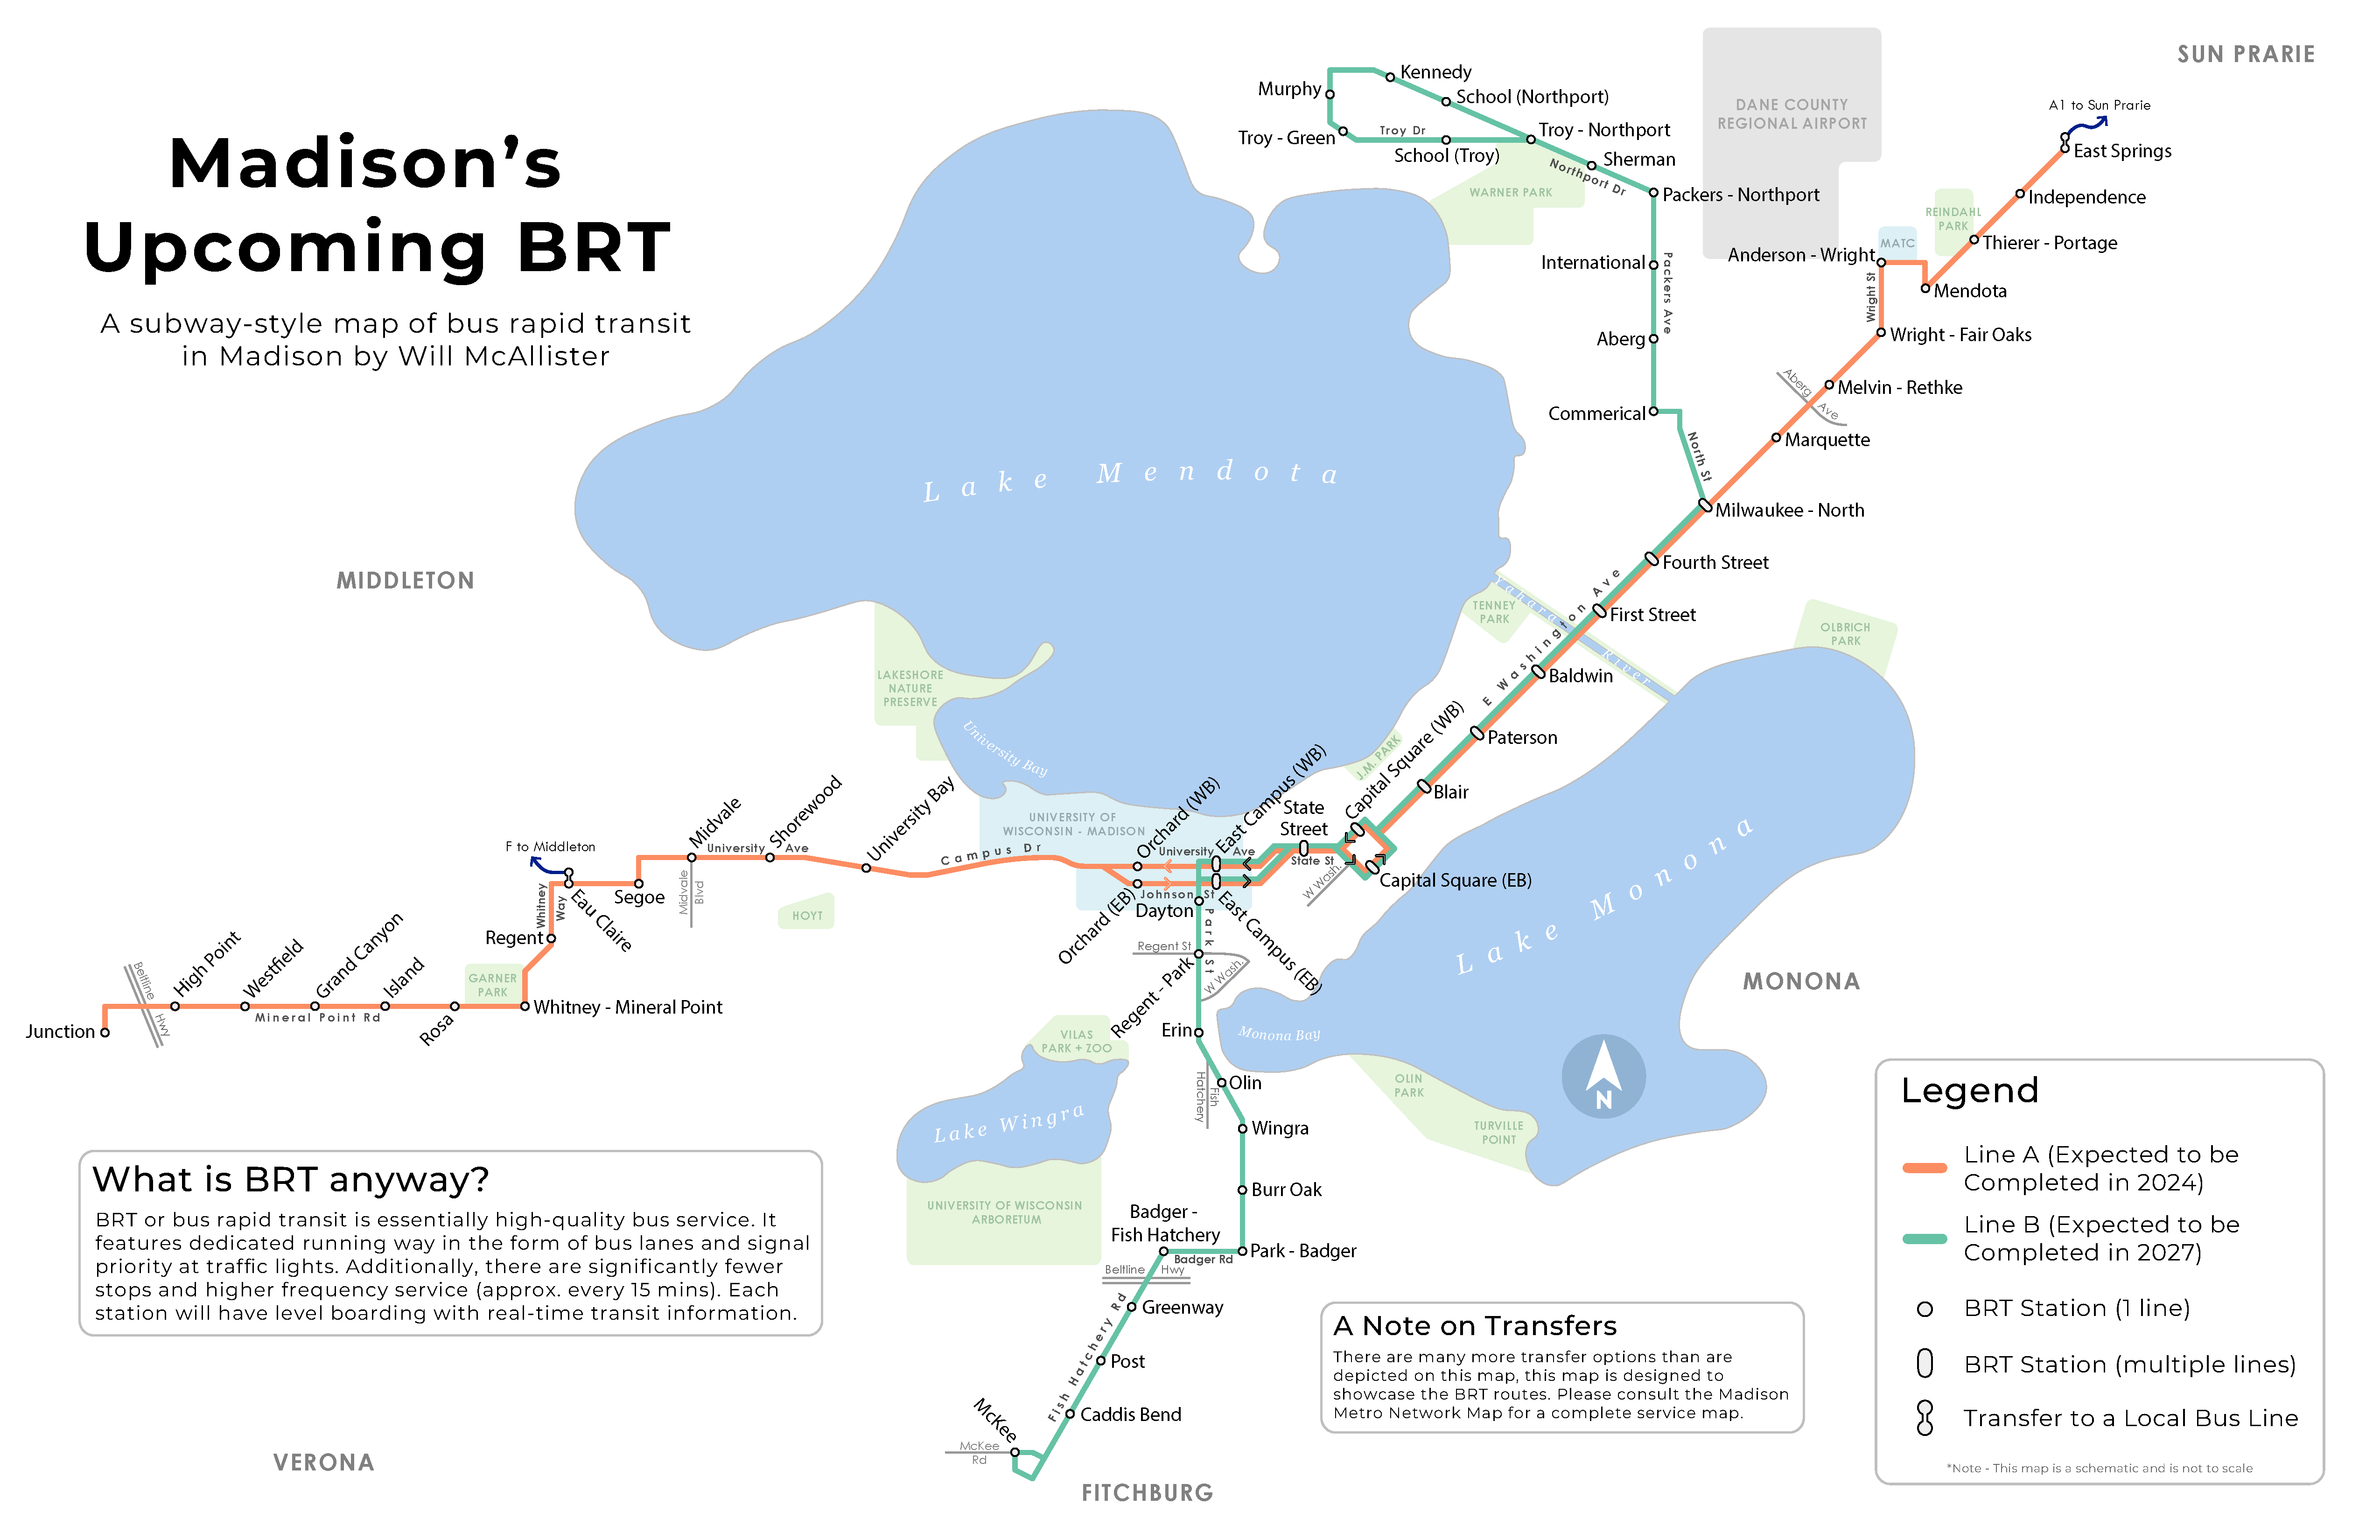
Visualizing the upcoming BRT system in Madison, WI
as a subway-style map.
For Intro to Cart | Petchenik Award Winner
Static | ArcPro + Illustrator
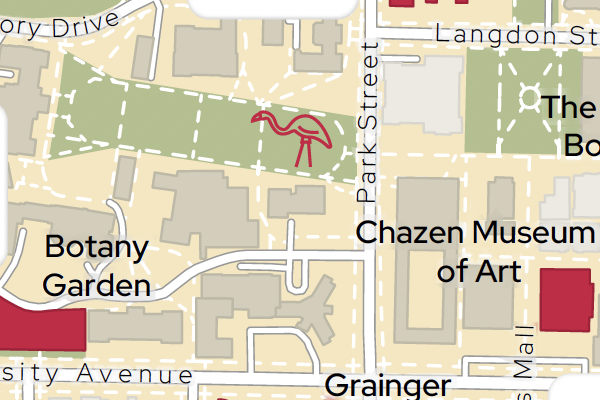
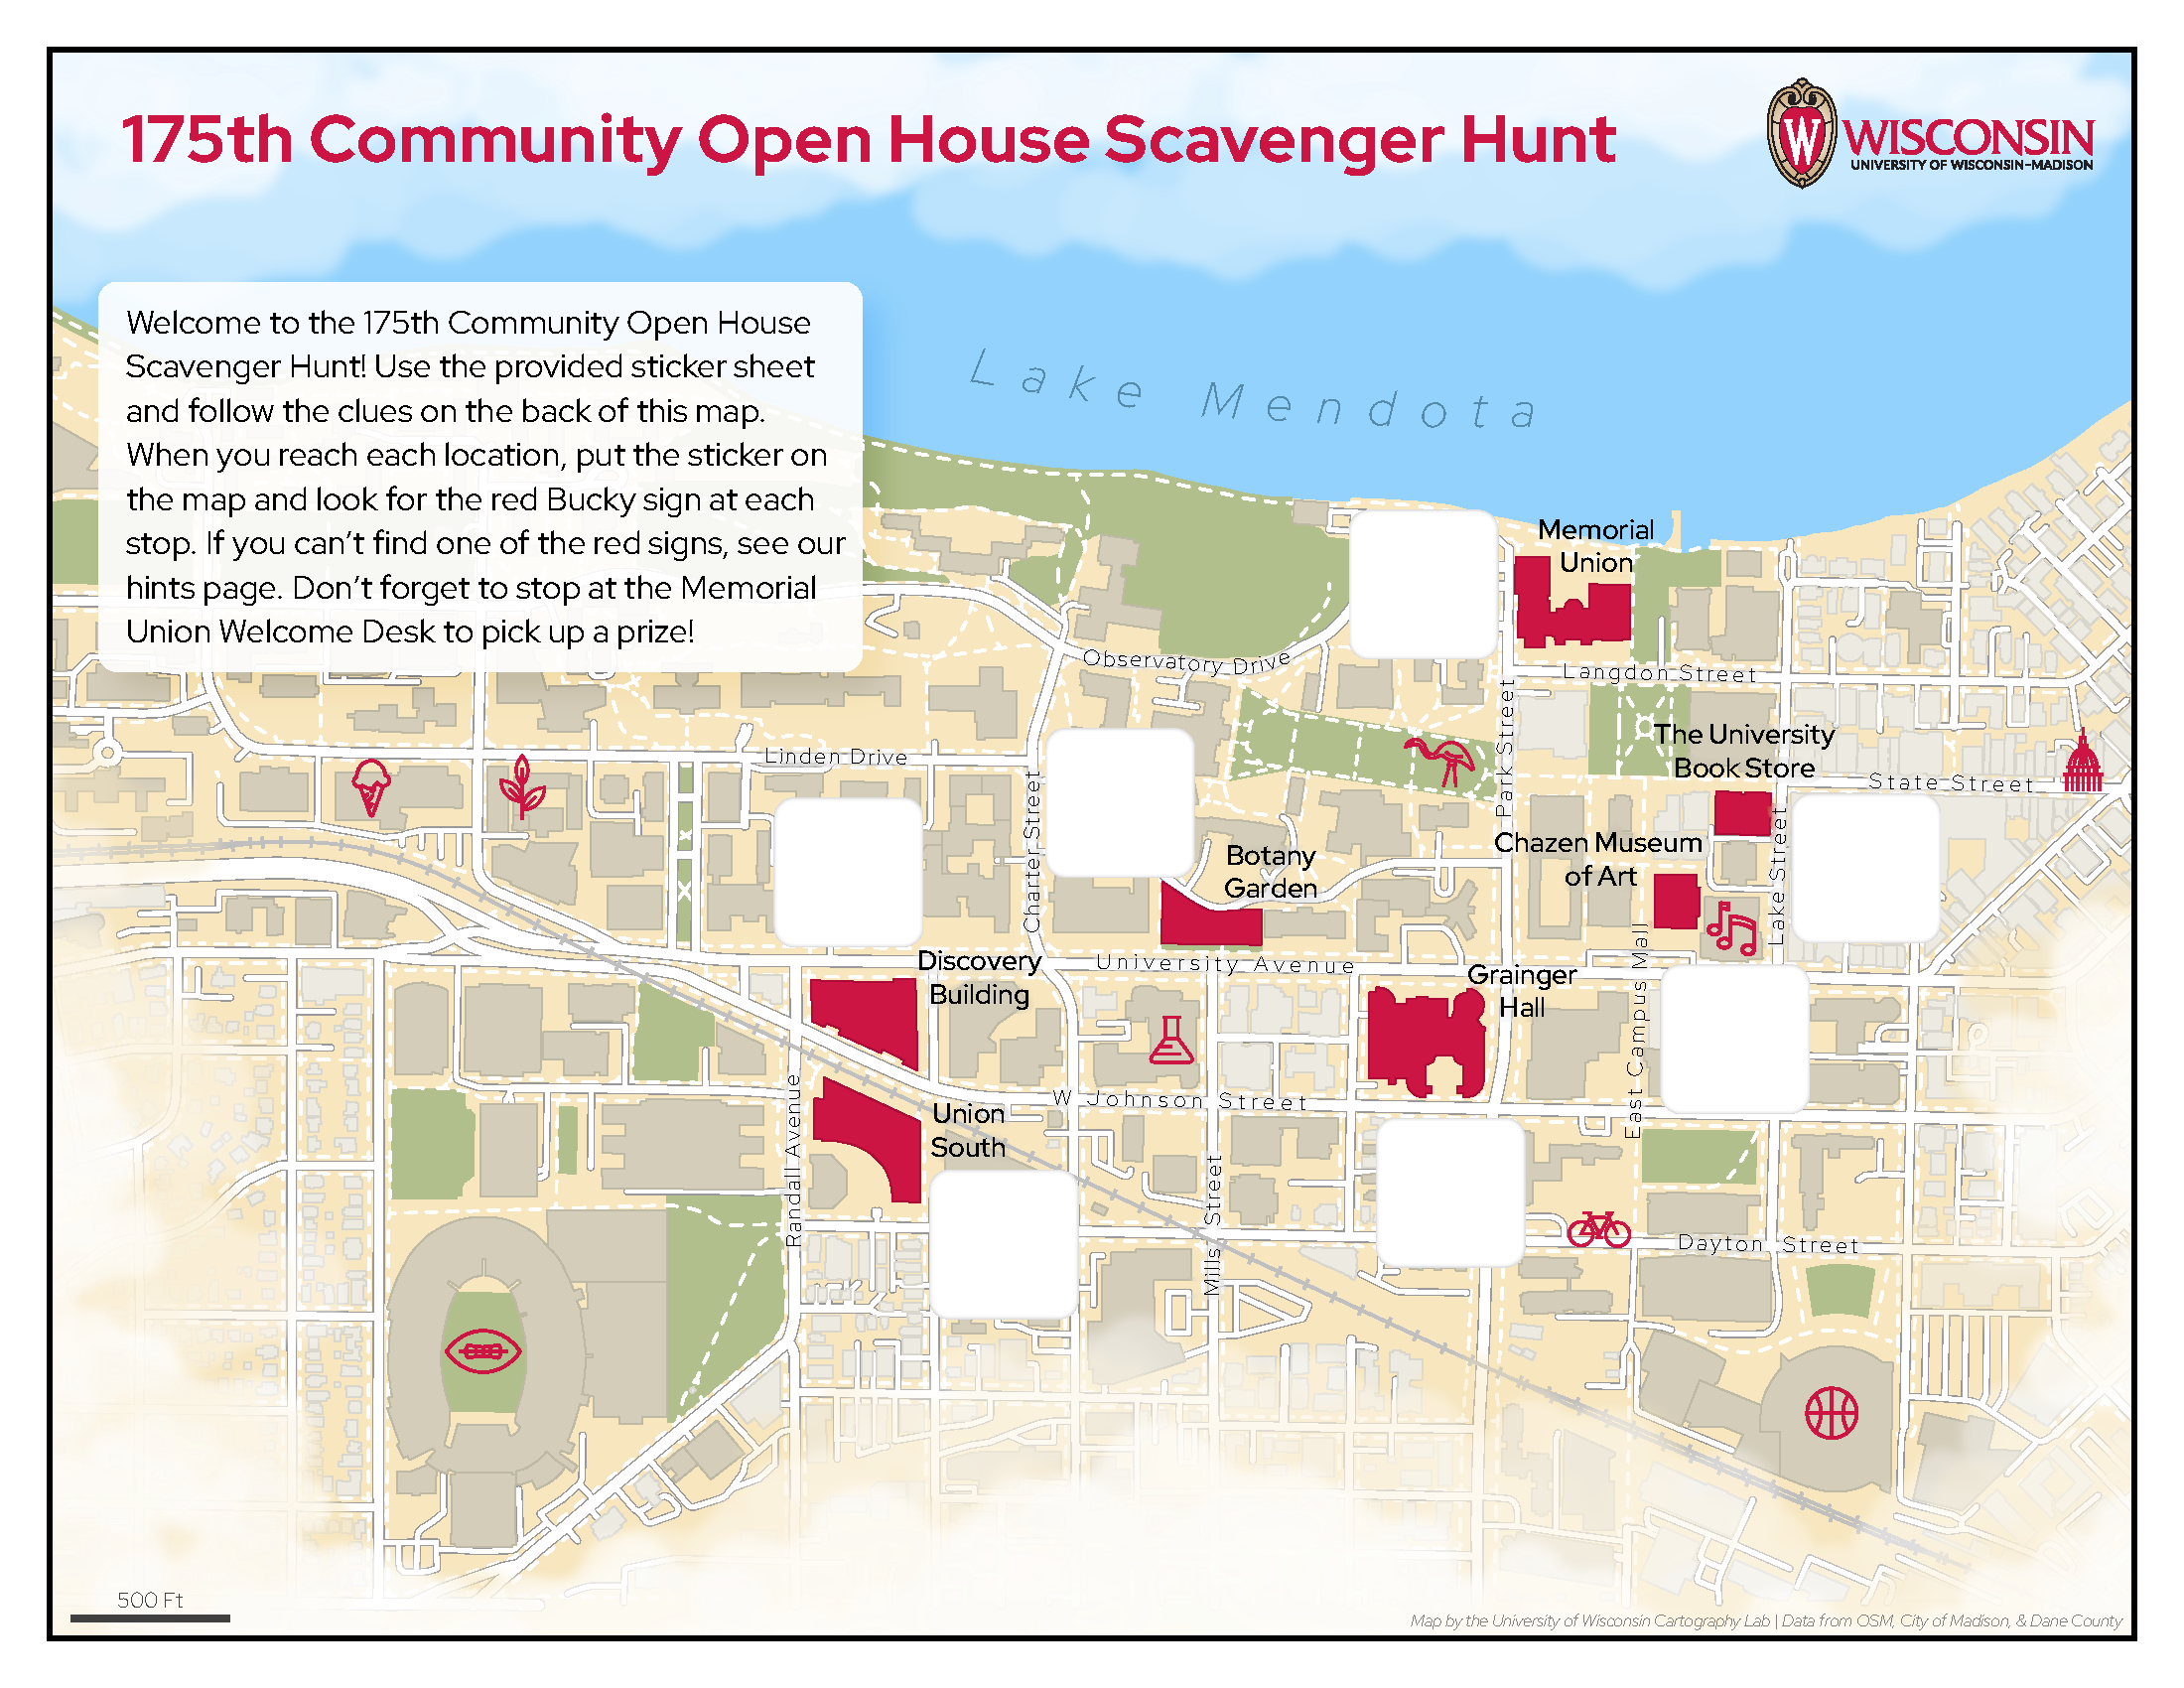
Campus Scavenger Hunt
This map was created for UW-Madison for
a scavenger hunt for the 175th anniversary of UW.
For the UW Cartography Lab
Static | ArcPro + Eduard + Illustrator
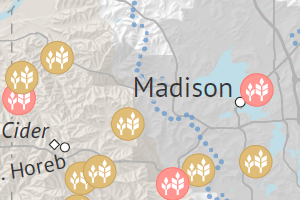
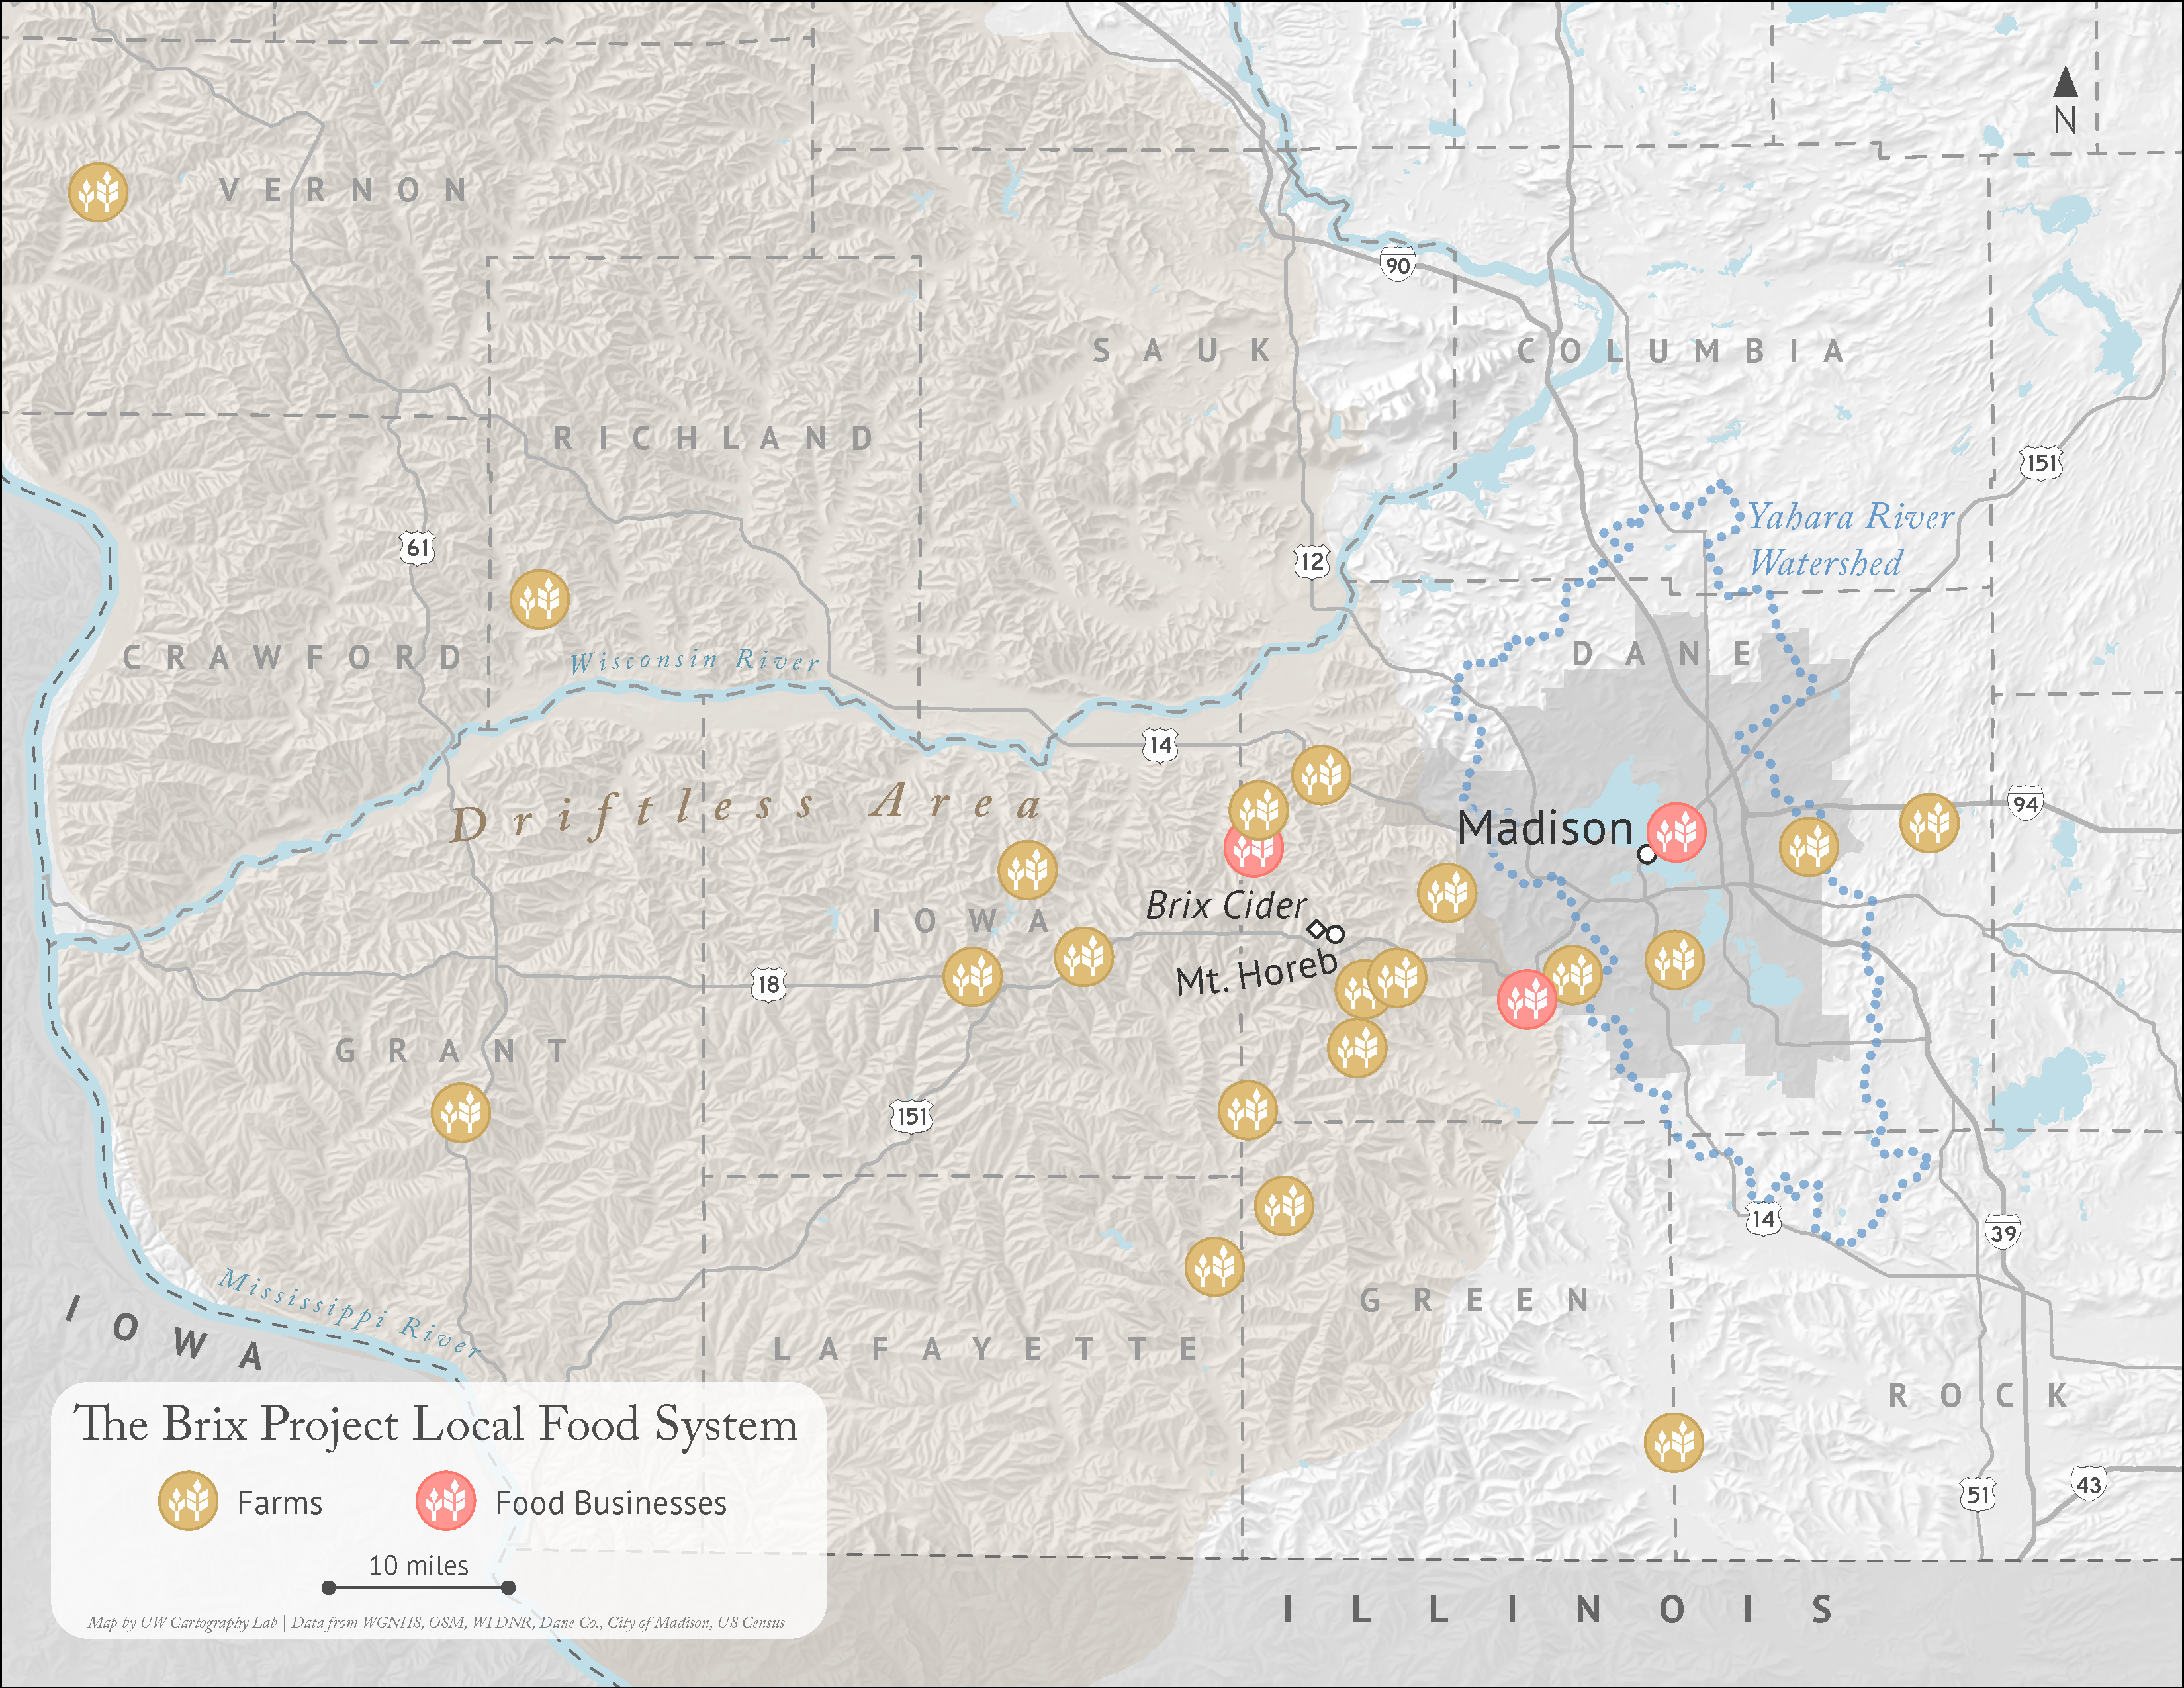
Southern Wisconsin Farms
This map was created for a UW-Madison Geography Graduate
Student for her dissertation.
For the UW Cartography Lab
Interactive | Leaflet
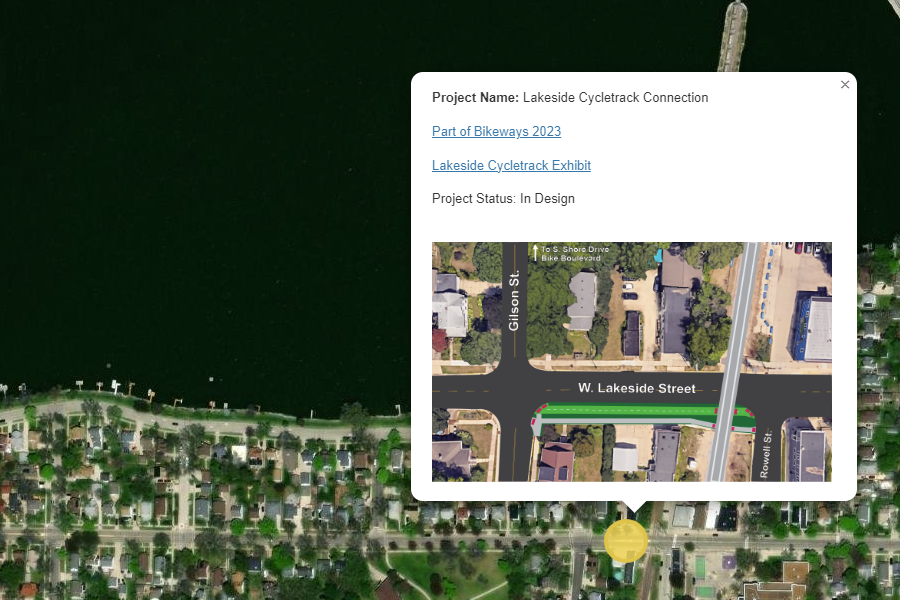
Madison Future Biking
Displays mockups for projects as well as a comparison of present vs future bike infrastructure.
For Interactive Cart & Geovisualization
Custom Basemap | Mapbox Studio
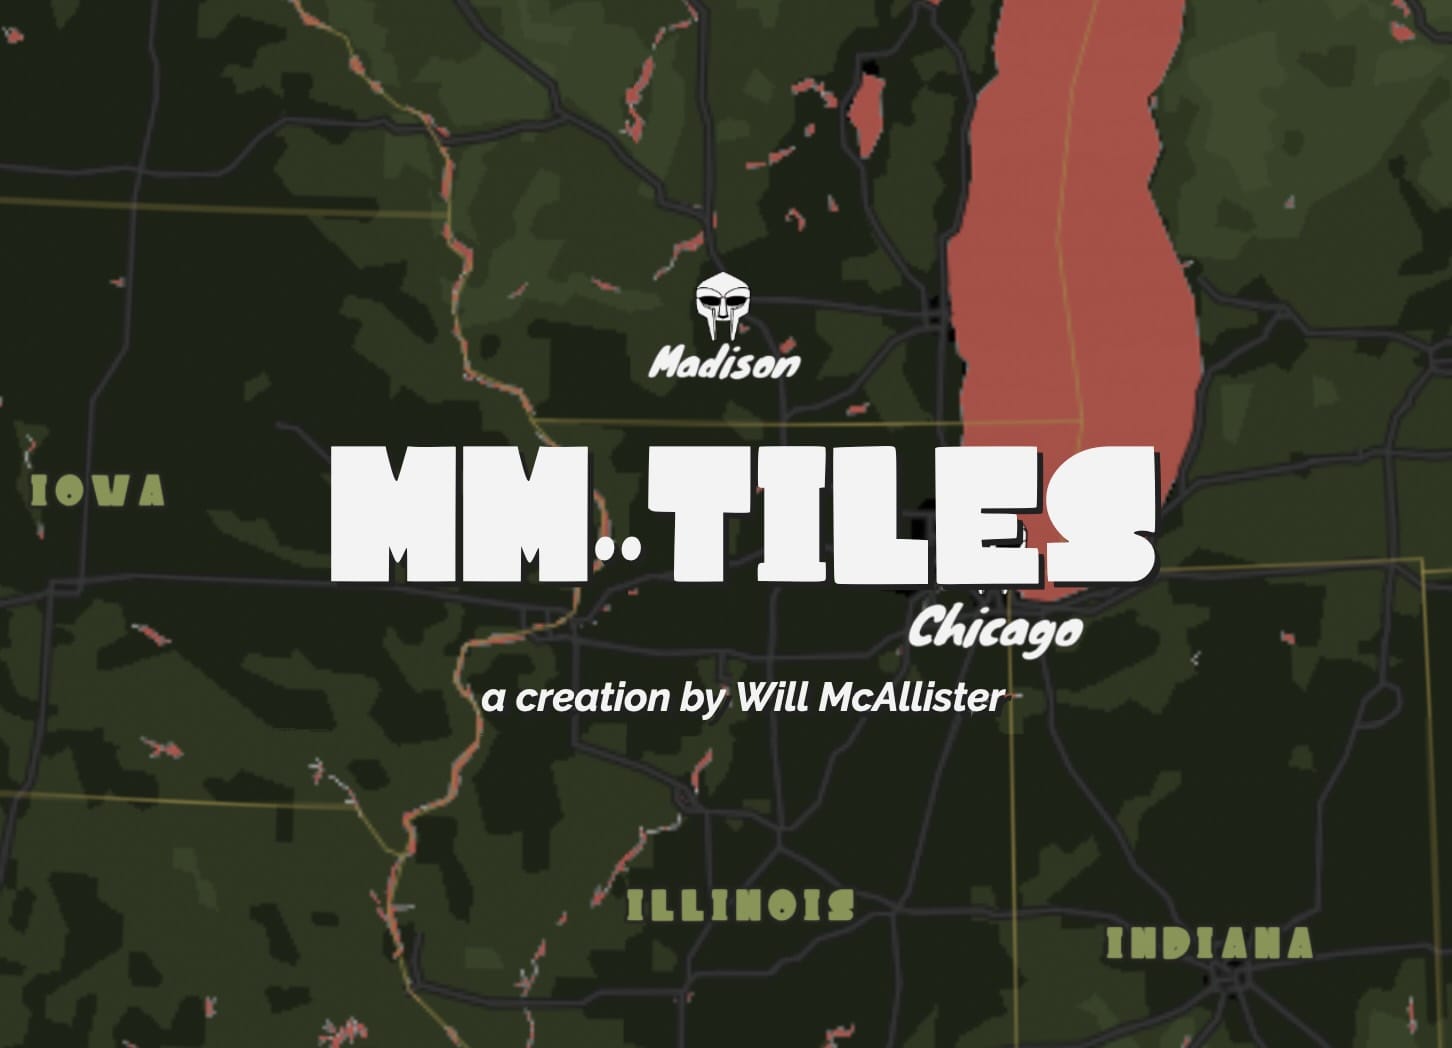
MM..Tiles
Custom basemap in the style of MF Doom cover art.
For Graphic Design in Cartography Course | Petchenik Award Winner
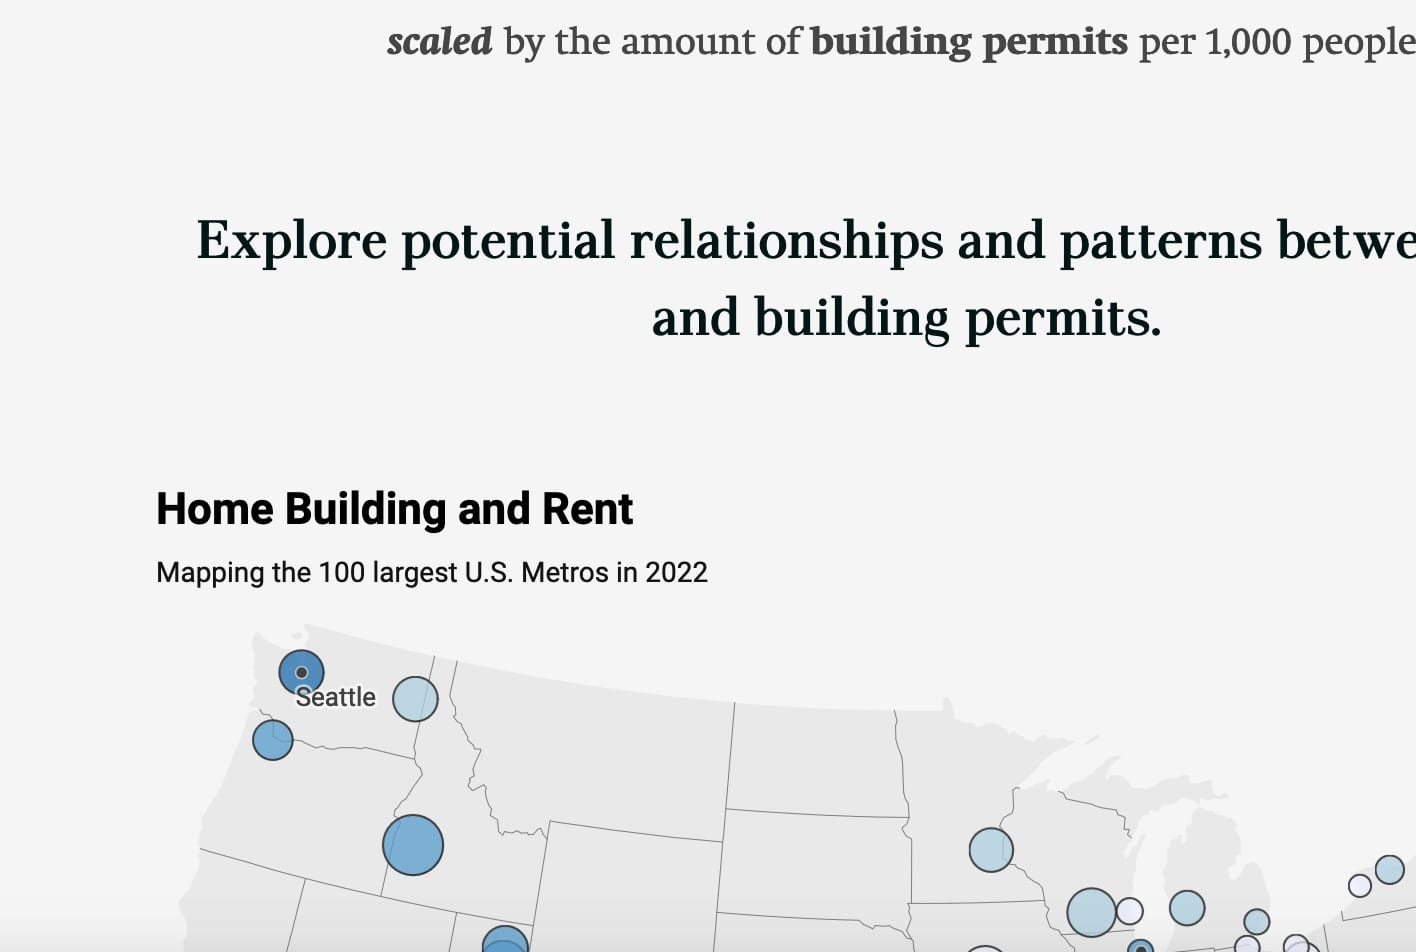
Visual Story | ESRI StoryMaps
We Can't Afford the Rent Here
Story map exploring housing (un)affordability in U.S. Metros.
For Graphic Design in Cartography Course
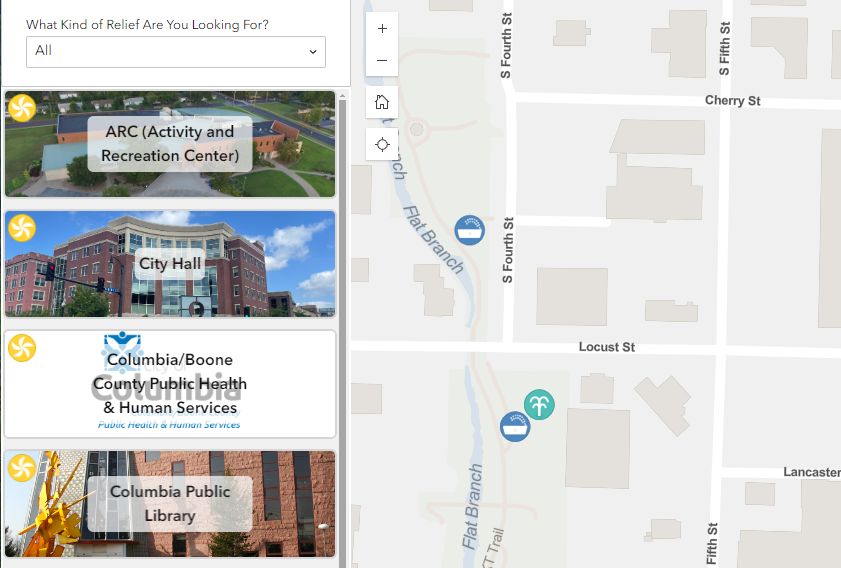
Interactive | Experience Builder
Show Me the Relief
Interactive Map to allow members of the public to discover places to cool off in the summer heat.
For the City of Columbia, MO
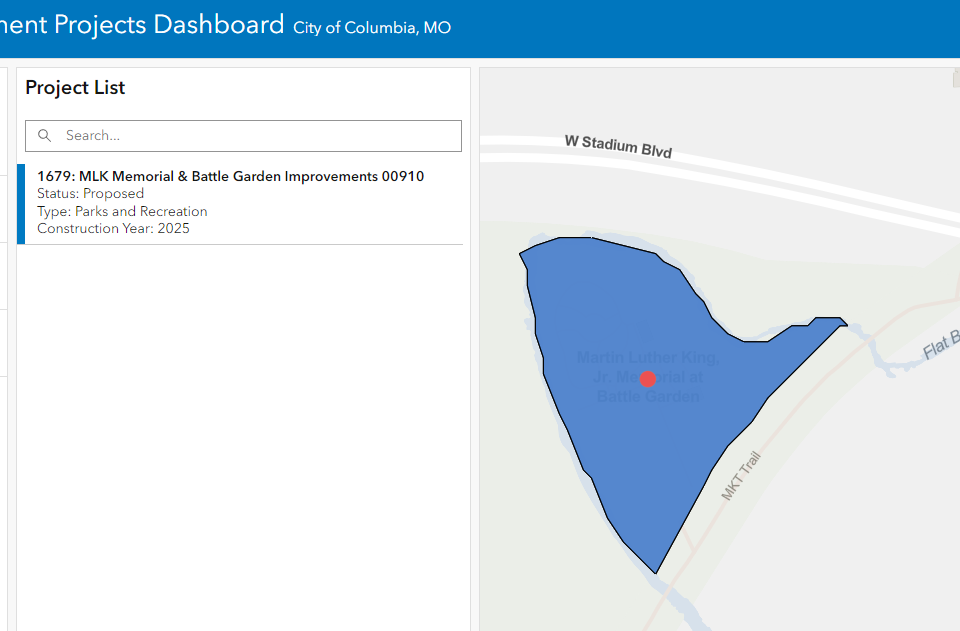
Interactive | ArcGIS Dashboard
Capital Improvement Projects Dashboard
Rebuilt the City's CIP Dashboard to display taxpayer funded city projects.
For the City of Columbia, MO
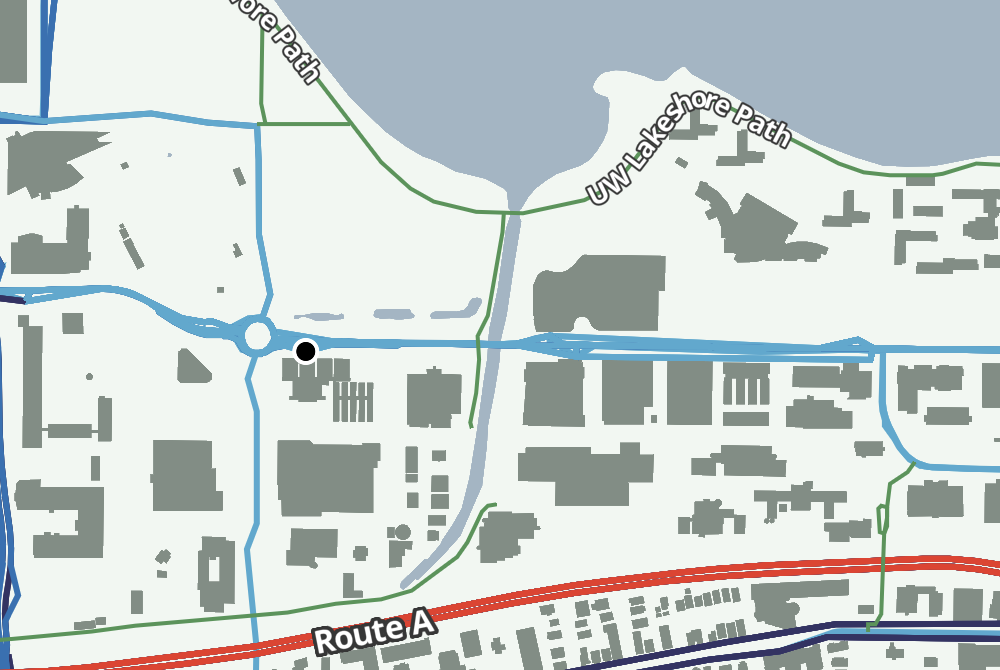
Custom Basemap | PMTiles, MapLibre
Custom PMTiles
Created custom vector tiles from scratch and without dependencies using PMTiles and MapLibre.
For Graphic Design in Cartography Course
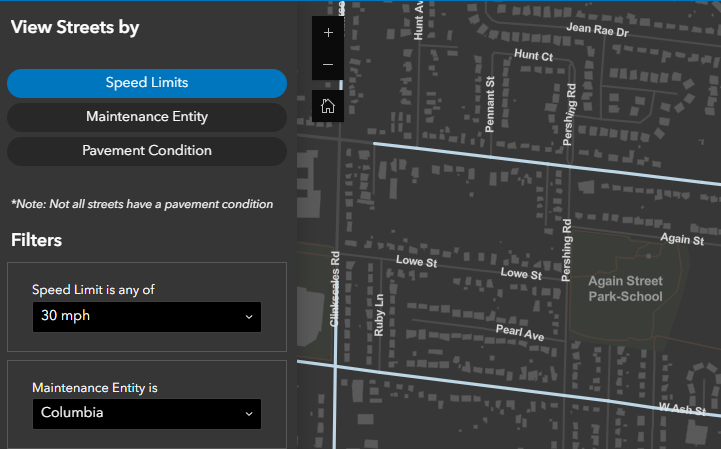
Interactive | Experience Builder
Streets Information Viewer
Interactive built for the Public Works Department to display street related information
including speed limits, ownership, and road condition.
For the City of Columbia, MO
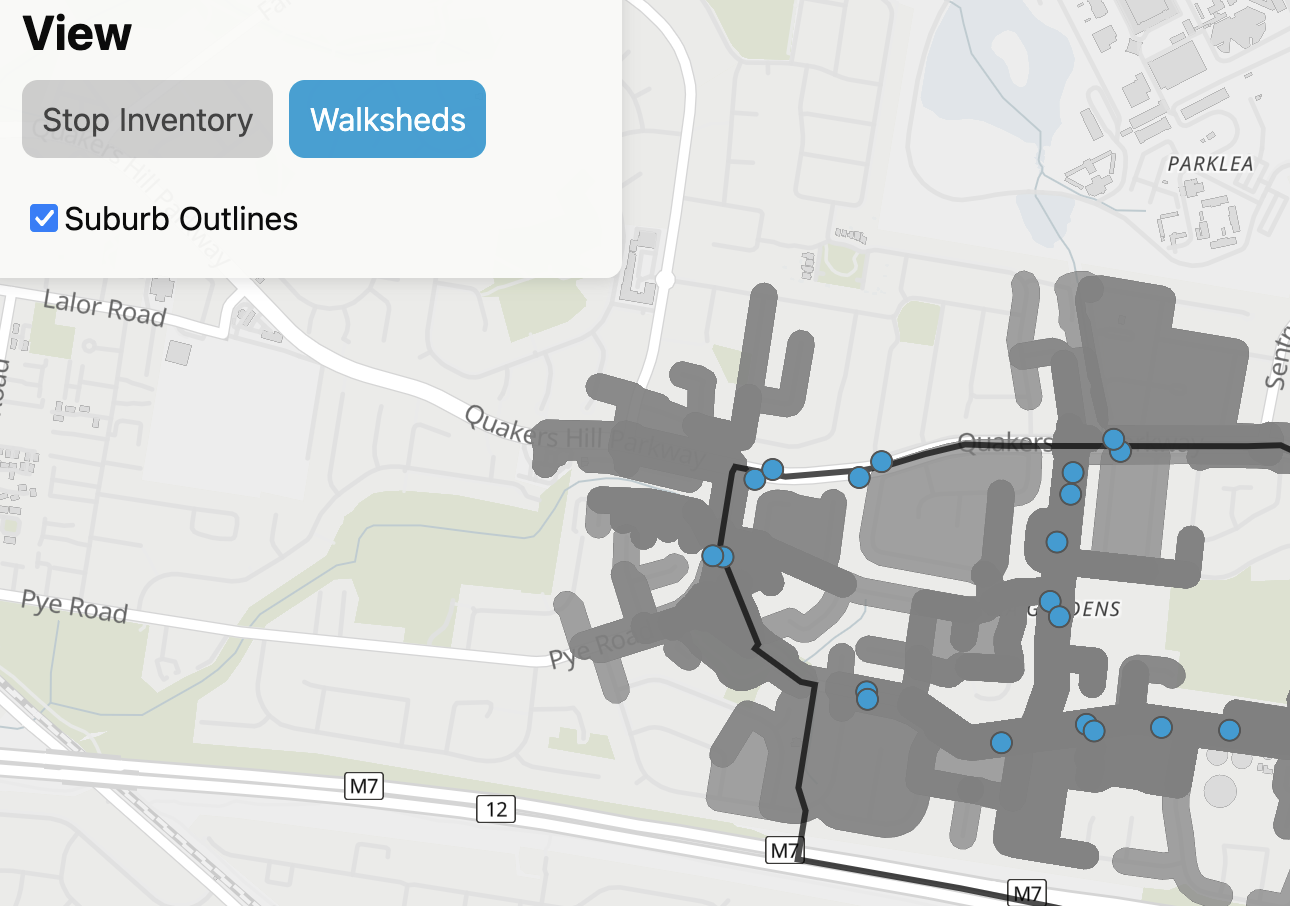
Interactive | MapLibre
Blacktown Bus Mapping
Interactive map showing bus stop conditions and walksheds in two study suburbs in Blacktown LGA, Australia.
Makes use of Vite and NPM, deployed to Github Pages.
For Urban Citizenship and Sustainability (Usyd)
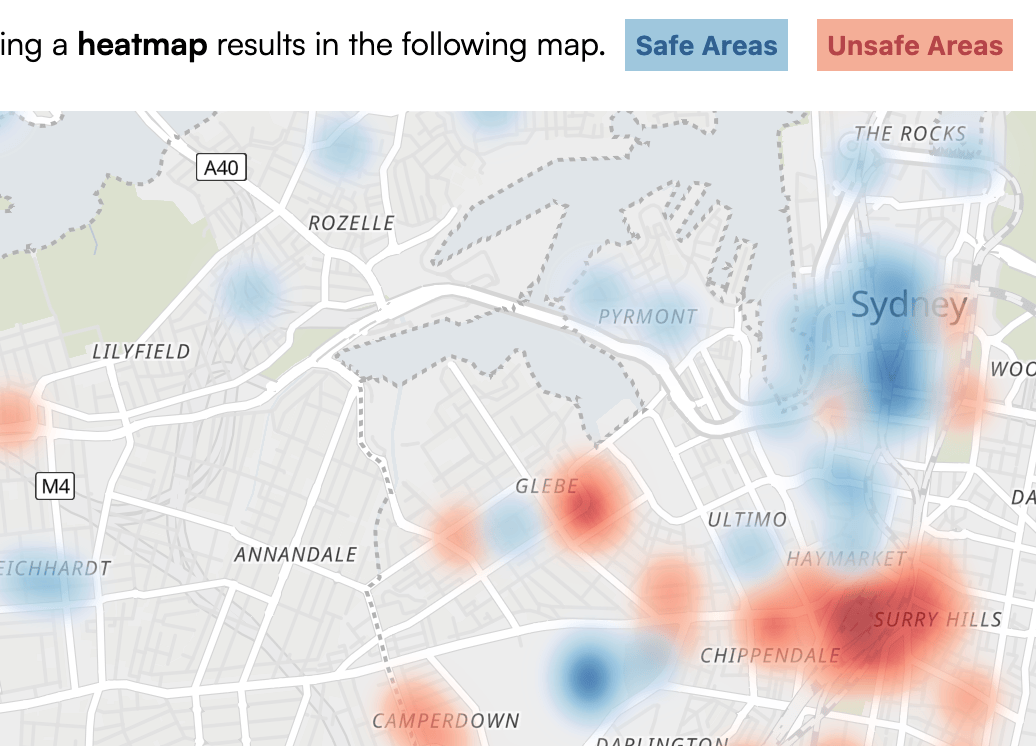
Interactive | MapLibre
Sydney Night Safety
Interactive map showing digitized results of a co-design pop-up event where participants marked areas they felt safe or unsafe on a physical map.